
In general, elasticity of demand means price elasticity. The concept of price elasticity is widely used in demand analysis. There are three methods of measuring price elasticity – total outlay method, point method and arc method. Here we concentrate only on total outlay method.
Total Outlay Method or Expenditure Method
In total outlay method, we see the change in expenditure as a result of change in price. Then on the basis of change in expenditure, we say whether the elasticity is equal to unity or greater than unity or less than unity. This can be illustrated by the help of schedule and figures.
1. Elasticity of Demand Equal to Unity (Ed = 1)
If the change in price does not change the total expenditure, the elasticity of demand is said to be equal to unity. In the table, the price falls from $10 to $9 to $8, but the total expenditure (PQ) remains unaltered at $10,000. So, the elasticity of demand is equal to unity.
Demand Schedule with Different
Elasticities
|
Elastic Demand
|
Unit Elastic Demand
|
Inelastic Demand
|
||||||
|
P
|
Q
|
PQ (TE)
|
P
|
Q
|
PQ (TE)
|
P
|
Q
|
PQ (TE)
|
|
$10
$9
$8
|
1,000
2,000
3,000
|
10,000
18,000
24,000
|
10
9
8
|
1,000
1,111
1,250
|
10,000
10,000
10,000
|
10
9
8
|
1,000
1,050
1,100
|
10,000
9,450
8,800
|
Adapted
from Watson & Getz: Price Theory & Its Uses
The unitary elastic demand can be illustrated by the help of a figure below.
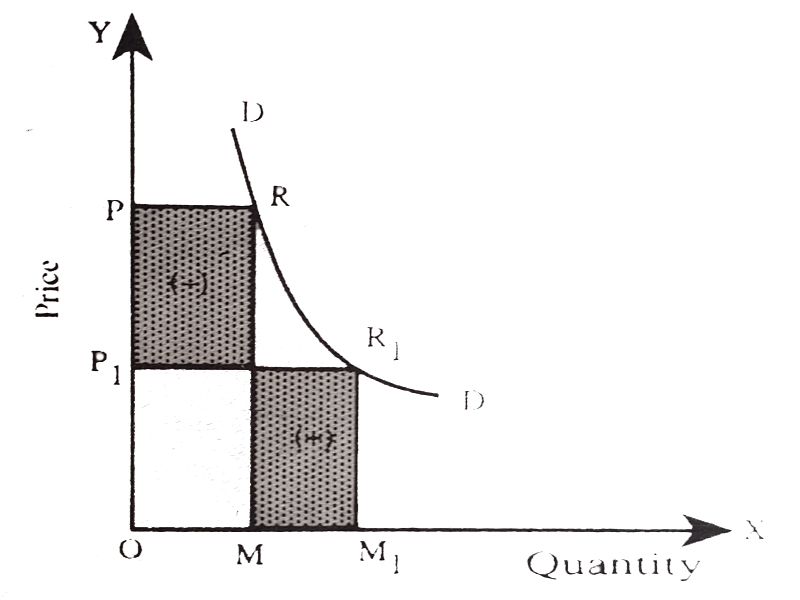 |
| Unitary Elastic Demand |
In the figure, at initial price OP, quantity demanded is OM and total outlay (PXQ) is equal to rectangle OMRP. When the price falls to OP1, quantity demanded increases to OM1, and total expenditure is equal to rectangle OM1R1P1. The total expenditure falls by the area marked (-) and rises by the area marked (+). The area (-) is equal to area (+). So, the spending remains unaltered. In other words, new total expenditure OM1R1P1 = initial total expenditure OMRP. So, elasticity of demand is equal to unity. When the demand curve is rectangular hyperbola, the elasticity of demand on all points of it is equal to unity.
2. Elasticity of Demand Greater than Unity (Ed > 1)
If the total expenditure increases with fall in price, elasticity of demand is said to be greater than unity. As shown in table, as the price falls from $10 to $9 to $8, the total expenditure increases from $10,000 to $18,000 to $24,000. So, the elasticity of demand is greater than unity. This can be illustrated by the help of following figure.
 |
| Greater Than Unity |
In the figure, the total expenditure at price OP is equal to rectangle OMRP. When price falls to OP1, the total expenditure increases to the rectangle OM1R1P1. The total expenditure falls by area marked (-), but rises by the area marked (+). The area (+) exceeds the area (-). The total spending increases. Hence, the elasticity of demand is greater than unity.
3. Elasticity of Demand Less than Unity (Ed < 1)
If the total expenditure falls with fall in price, the elasticity of demand is said to be less than unity. As shown in table, as the price falls from $10 to $9 to $8, the total expenditure falls from $10,000 to 9,450 to $8,800. Hence, elasticity of demand is less than unity. This can be illustrated by the help of a figure below.
 |
| Less Than Unity |
As shown in the figure, when price is OP, the total expenditure is equal to rectangle OMRP. When price falls to OP1, the total expenditure falls to the rectangle OM1R1P1. The total expenditure falls by the area marked (-) but rises by the area marked (+). The area (+) is smaller than the area (-). The total expenditure falls. Hence, elasticity of demand is less than unity.
You may also like to read:
No comments:
Post a Comment